Two Years of U.S. LNG Exports
On April 16th, 2018 the U.S. Department of Energy released the most recent data for U.S. vessel-borne LNG exports of domestically-produced LNG. The report included data through February 2018. The first LNG export from the Sabine Pass LNG terminal took place in February of 2016. Images and data below are from the most recent U.S. DOE report providing cumulative two-year LNG export data.
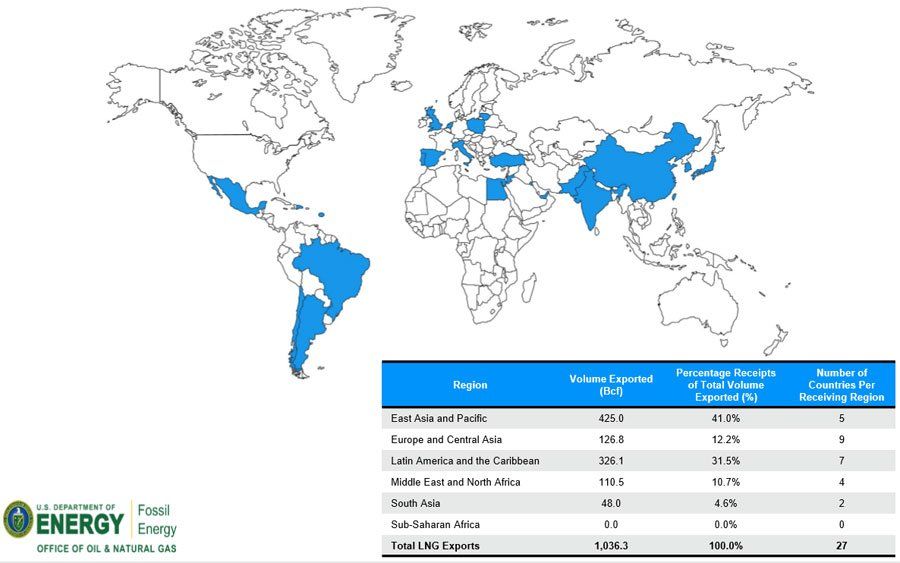
Below: Exports of Domestically-Produced LNG Delivered (Cumulative starting from February 2016 through February 2018)
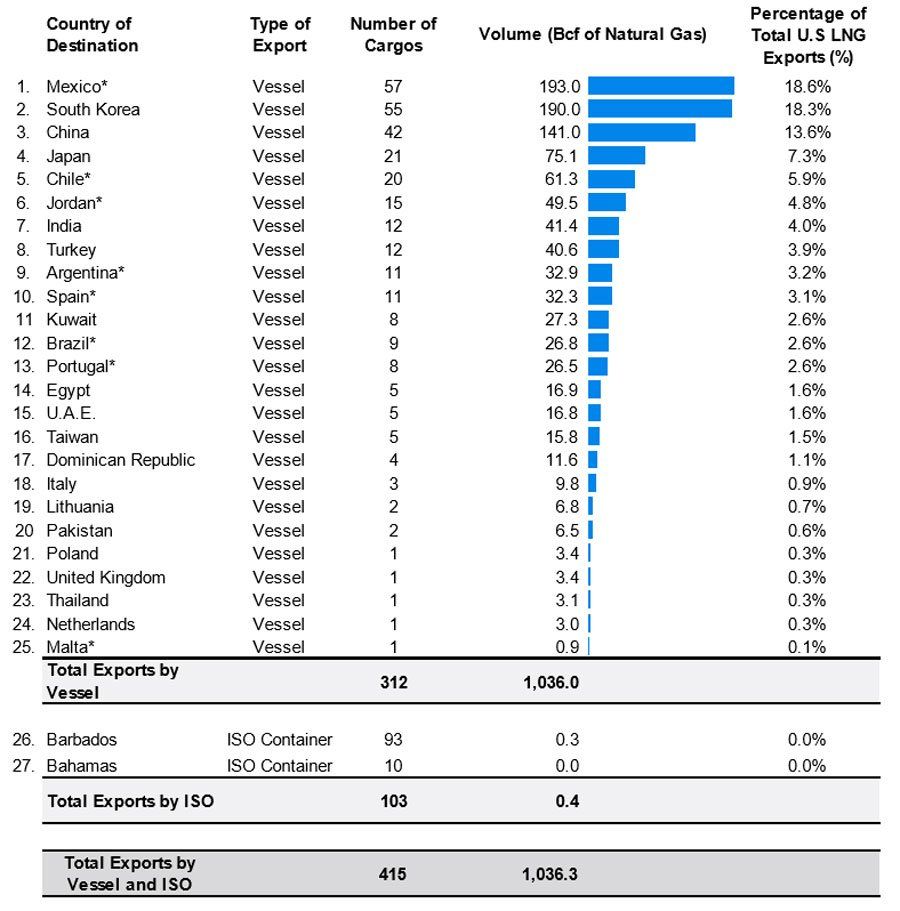
Below: Shipments of Domestically-Produced LNG Delivered (Cumulative starting from February 2016 through February 2018. All below data are exports from the Sabine Pass LNG Terminal except as noted exports via ISO containers.
Note:
Volume and Number of Cargos are the cumulative totals of each individual Country of Destination by Type of Export starting from February 2016.
* Split cargos counted as both individual cargos and countries.
Vessel = LNG Exports by Vessel and ISO container = LNG Exports by Vessel in ISO Containers.
Does not include re-exports of previously-imported LNG. See table 2c for re-exports data.
Totals may not equal sum of components because of independent rounding.
Receive the most important LNG headlines in your email inbox each business day. Just sign up for our FREE LNG Headline Daily Newsletter.
Sign Up Here.